BETTERWARE REPORTS FOURTH QUARTER AND FISCAL YEAR 2021 RESULTS
GUADALAJARA, Mexico, Feb. 10, 2022 /PRNewswire/ -- Betterware de Mexico S.A.P.I. de C.V. (NASDAQ: BWMX), ("Betterware" or the "Company"), announced today its consolidated financial results for the fourth quarter and fiscal year 2021. The figures presented in this report are expressed in nominal Mexican Pesos (Ps.) unless otherwise noted, presented and approved by the Board of Directors, prepared in accordance with IFRS, and may include minor differences due to rounding. The Company notes that its financial year of 2021 consisted of 52 weeks while the financial year of 2020 consisted of 53 weeks. The additional week during the financial year of 2020 occurred during the fourth quarter. The Company will host a webcast presentation and conference call at 9:00 am (Eastern Time) on February 11, 2022, to discuss its results for the financial year of 2021. The slide presentation that will accompany management remarks can be reviewed at investors.betterware.com.mx.
Key Highlights of 2021
- Strengthened network of associates and distributors.
- Net Revenue +41% YoY growth and EBITDA +33% YoY growth vs. comparable weeks in 2020.
- Strong balance sheet and cash flow allow for continued dividend payments.
- Acquisition of JAFRA´s operations in Mexico and the United States.
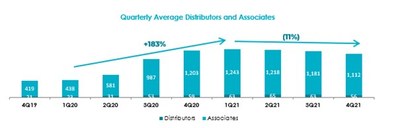
Luis G. Campos, Executive Chairman of the Board, stated, "Betterware achieved extraordinary growth from 1Q 2020 to 1Q 2021, mainly driven by our increase in our average associates and distributors base of 183%. This translated into exceptional performance in net revenue and EBITDA. While it was quite a positive result, it turned comparisons with respect to 2020 challenging. Despite a much higher base, 2Q 2021 and 3Q 2021 showed strong YoY growth and traction in net revenues, of 81% and 4% respectively. As for 4Q 2021, on top of the harder comparison base, our business was impacted by a sluggish consumer in Mexico and by external factors related to supply chain disruptions prevailing globally, which resulted in a decline in net revenues and EBITDA for the quarter.
On an annual perspective, after undergoing a full year of consolidation of our sales network during 2021 and proactively dealing with external impacts, we are pleased with our performance, which led to a 41% growth in net revenue and a 33% growth in EBITDA vs. comparable weeks in 2020 and a 27.9% EBITDA margin.
We have proven once again our ability to adapt and capitalize on business opportunities as they emerge and transform them into consistent value generation for our shareholders. Going forward, we will continue executing our strategy based on our three business pillars: product innovation, business intelligence and technology. We start 2022 with a strengthened network of distributors and associates, confident of Betterware´s profitable growth in the years to come, which will lead us to reach our target of 40% household penetration in Mexico by 2025.
Aligned to our long-term agenda, the compelling acquisition of JAFRA, a world leading brand of Direct Selling in the Beauty and Personal Care (B&PC) products industry with a strong presence in Mexico and the United States, announced last month, will contribute towards product diversification, our international expansion strategy, acceleration of profit growth, and acceleration of our digital transformation, while maintaining a low leverage ratio. For Betterware the best is yet to come."
Luis G. Campos
Executive Chairman of the Board
FY 2021 Results
|
Metric |
Amount $ in million |
Variation (Comparable number of Weeks) |
Comment |
|
Net Revenue |
Ps. $10,039.7 |
+41% vs. comparable 2020 +225% vs. 2019 |
· Growth of average associates and distributors base. |
|
Gross Margin |
56.2% |
+151 bps vs. 2020 |
· Margin expansion reflects efficient cost management despite freight cost pressures. |
|
EBITDA |
Ps. $2,798.5 |
+33% vs. comparable 2020 +229% vs. 2019 |
· Growth in net revenues. |
|
EBITDA Margin |
27.9% |
(193 bps) vs. 2020 |
· Same as EBITDA. |
|
Net Income |
Ps. $1,826.8 |
+440% vs. 2020 +287% vs. 2019 |
· Net income in 2020 negatively impacted by non-cash expenses related to Warrants. |
|
EPS |
Ps. $49.41 |
+398% vs. 2020 |
· Same as Net Income |
Betterware´s main task for 2021 was to consolidate our distributors and associates' base, after achieving extraordinarily high triple digit growth in a short period of time, from 1Q 2020 to 1Q 2021.
During the second half of 2021, people initiated the return to their normal lifestyles, leaving behind the worst months of the pandemic. As a result, some of the people that had joined our network during 2020, went back to their customary activities and decided not to continue with Betterware, thus resulting on a higher-than-average churn rate for associates peaking at 4.6% a week (vs historical average churn rate of 2.8% a week) and a consequent mild decline in our average network of associates and distributors.
In addition to keeping most of the sales network added, we managed to improve its KPIs by maintaining weekly activity at ~34% for associates and ~80% for distributors through 2020 and 2021. Furthermore, following 2020's extraordinary growth, tenure increased versus preceding years, strengthening to our sales network via an adequate mix of seniors and newcomers.
4Q 2021 Results
During 4Q 2021 our business was negatively impacted by the following factors:
- Consumption softened compared to 1H2021, which led to increased promotions
- Worldwide supply chain disruptions:
- Shortage of sea freight containers led us to increase air freight expenses
- Stricter than expected energy restrains in China impacted our fulfillment capacity
- Sea freights costs continued at abnormally high levels
These impacts led to lower-than-expected total net revenue and EBITDA for the fourth quarter and for 2021.
|
Metric |
Amount $ in million |
Variation (Comparable number of Weeks) |
Comment |
|
Net Revenue |
Ps. $2,182.1 |
(11%) vs. comparable 4Q 2020 +176% vs. 4Q 2019 |
· Slightly lower average associates and distributor base vs. 4Q 2020 |
|
Gross Margin |
53.7% |
(220 bps) vs. 4Q 2020 |
· Increased use of airfreights. |
|
EBITDA |
Ps. $420.8 |
(43%) vs. comparable 4Q 2020 +85% vs. 4Q 2019 |
· Partially impacted by one-time air freight expenses |
|
EBITDA Margin |
19.3% |
(1,173 bps) vs. 4Q 2020 |
· Lower operating leverage due to lower volumes |
|
Net Income |
Ps. $214.0 |
+322% vs. 4Q 2020 +131% vs. 4Q 2019 |
· Net income in 4Q 2020 negatively impacted by non-cash expenses related to Warrants. |
|
EPS |
Ps. $5.74 |
+309% vs. 4Q 2020 |
· Same as Net Income |
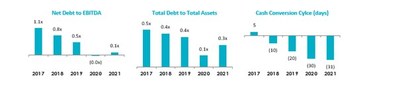
Strong Balance Sheet
After 4Q 2021, Betterware's balance sheet reflects a strong financial position:
- Conservative Net Debt to EBITDA ratio
- Low Total Debt to Total Assets and
- Negative cash conversion cycle
The main strengths of the Balance Sheet reflect the company's differentiated Business Model, which allow the company to have a high cash conversion rate and low liquidity requirements. Betterware´s cost structure allows for relevant operational flexibility to adapt its operation as demand increases or decreases.
Long-term Growth Expectations
Since Q3 2021 to date, we have confirmed that:
- As people went back to their in-person activities, we realized that the "new normal", which we previously thought would remain, will not last forever.
- Supply chain disruptions and cost pressures would have a higher impact in our revenues and costs than previously expected.
In response to the above, the company started adjusting its commercial strategies with the objective of increasing its net revenue, EBITDA and free cash flow. These adjustments include, among others:
|
Commercial Actions | |||||
|
Pricing Actions |
Price Mix |
Catalogue Frequency |
Hybrid Model |
Product Innovation |
Incentives Program |
|
General price increase of 12% to offset cost pressures |
Increasing the share of lower-price items in our catalogues |
Increased from 9 to 12 per year, providing enhanced flexibility to adapt |
Increased in-person interaction with distributors and associates |
Increasing share of new products per catalogue, from current 10% to around 20% during 2022 |
Increased focus on recruitment and retention of distributors and associates |
To proactively address cost pressures, and in response to the changes in the business environment, the Company is already engaged in the execution of a series of initiatives, including the following:
|
Operational Actions | |||
|
Freight Costs |
Supply Chain (China) |
Foreign Exchange |
Efficiency and Productivity |
|
Signed contracts for 1/3 of our expected shipments for 2022 and 2023 at favorable rates |
Accelerating domestic manufacturing plans: 20% local sourcing by year end 2022, from 7% as of 2021 |
Cover 100% of our expected US Dollar operating needs. Currently, approx. 85% covered. Covered around 80% of Jafra's acquisition price. |
Achieve operational efficiencies with our automated Pick-and-Pack Tower during 2022 |
As we start 2022 with a much stronger base of distributors and associates, our churn rates are trending towards normal levels, and the company´s operating structure is now sufficient to achieve the expected growth for the oncoming years to reach a 40% household penetration, which should provide for incremental operating leverage as revenues remain growing.
2022 Guidance
We remain confident in our ability to navigate well during the year ahead given our strategic advantages and initiatives in place that position our Company to diversify our supply chain, broaden our categories and product offering, as well as retain and grow distributors and associates.
That said, and given the uncertainties still present, we believe it is prudent to provide guidance for fiscal 2022 that includes Net Revenue and EBITDA in line with Fiscal 2021, assuming no significant deterioration in the external environment. This guidance implies that in 2H 2022 we will show YoY growth.
Dividend
Aligned to the Company's ability to generate strong cash flow after investments, its Board of Directors has proposed to pay the fourth installment of its dividend of Ps. 350M, which implies an annualized dividend yield of approximately 8.7%. The 4Q 2021 dividend is subject to approval at the next Ordinary General Shareholders' Meeting to be held on February 11, 2022.
For the long term, we remain on track to increase our household penetration to reach our target 40% by 2025, while expanding our share of wallet through successful product innovation and increased participation in new market niches.
JAFRA Acquisition
On January 18, 2022, Betterware announced the acquisition of JAFRA's operations in Mexico and the United States, which is considered to be a transformational deal. The transaction is expected to close in 1H 2022, subject to antitrust and regulatory approval in Mexico.
The rationale for the transaction is:
- Acquisition price of US$255mm, equivalent to Ps. 5,355mm, on a debt-free, cash-free basis, to be funded mainly with debt. With implied pre-synergies multiple of ~5.5x 2022E EBITDA, 4.8x 2022E EBITDA considering the mid-point of the synergies.
- Accretive since the first year, expected to add US$0.34/share to EPS in 2022 and over US$45 mm pre-synergies. The EPS and EBITDA added would be US$0.48 and US$54mm, respectively, considering the mid-point of the synergies.
- Increased diversification of Betterware's current operations by category and by geography, including a faster and more efficient way to enter the vast US market.
- Elevated JAFRA's revenue growth and profit potential.
- Accelerated digital transformation of JAFRA by leveraging Betterware's omni-channel capabilities and capitalize on the significant e-commerce opportunity and strong direct selling online market trends.
We are very excited about the acquisition of JAFRA, which reflects our continued assessment of opportunities to build operational and financial efficiencies into our business. We look forward to supporting JAFRA and beginning to implement our strategies once the transaction is authorized and closed.
JAFRA's know-how and presence in the US market of over 65 years, will pave the way for Betterware to enter the attractive US market by the 2Q 2023 and continue expanding our business.
|
Betterware de México, S.A.P.I. de C.V. | ||
|
Dec 2021 |
Dec 2020 |
|
|
Assets |
||
|
Cash and cash equivalents |
1,175,198 |
649,820 |
|
Trade accounts receivable, net |
836,744 |
757,806 |
|
Accounts receivable from related parties |
24 |
- |
|
Inventories |
1,339,378 |
1,274,026 |
|
Prepaid expenses |
90,104 |
94,501 |
|
Derivative financial instruments |
28,193 |
- |
|
Other assets |
83,105 |
130,417 |
|
Total current assets |
3,552,746 |
2,906,570 |
|
Property, plant and equipment, net |
1,069,492 |
791,127 |
|
Right of use assets, net |
17,384 |
24,882 |
|
Deferred income tax |
- |
17,605 |
|
Investment in associates |
497 |
- |
|
Intangible assets, net |
369,760 |
319,361 |
|
Goodwill |
371,075 |
348,441 |
|
Other assets |
4,274 |
5,774 |
|
Total non-current assets |
1,832,482 |
1,507,190 |
|
Total assets |
5,385,228 |
4,413,760 |
|
Liabilities and Stockholders' Equity |
||
|
Short term debt and borrowings |
28,124 |
105,910 |
|
Accounts payable to suppliers |
1,984,932 |
2,078,628 |
|
Accrued expenses |
171,047 |
109,767 |
|
Provisions |
115,192 |
151,008 |
|
Income tax payable |
101,994 |
85,221 |
|
Value added tax payable |
- |
26,703 |
|
Statutory employee profit sharing |
55,305 |
7,354 |
|
Lease liability |
6,102 |
7,691 |
|
Derivative financial instruments |
- |
295,115 |
|
Total current liabilities |
2,462,696 |
2,867,397 |
|
Employee benefits |
1,506 |
1,678 |
|
Derivative financial instruments |
- |
25,179 |
|
Deferred income tax |
98,515 |
56,959 |
|
Lease liability |
11,778 |
16,687 |
|
Long term debt and borrowings |
1,482,261 |
523,967 |
|
Total non-current liabilities |
1,594,060 |
624,470 |
|
Total Liabilities |
4,056,756 |
3,491,867 |
|
Stockholders' Equity |
1,313,817 |
921,893 |
|
Non-controlling interest |
14,655 |
- |
|
Total Stockholders' Equity |
1,328,472 |
921,893 |
|
Total Liabilities and Stockholders' Equity |
5,385,228 |
4,413,760 |
|
Betterware de México, S.A.P.I. de C.V. |
|
Q4 2021 |
Q4 2020 |
∆% |
|
|
Net revenue |
2,182,069 |
2,601,167 |
(16.1%) |
|
Cost of sales |
1,010,815 |
1,147,641 |
(11.9%) |
|
Gross profit |
1,171,254 |
1,453,526 |
(19.4%) |
|
Administrative expenses |
274,051 |
262,696 |
4.3% |
|
Selling expenses |
439,824 |
293,681 |
49.8% |
|
Distribution expenses |
60,327 |
107,534 |
(43.9%) |
|
Total expenses |
774,202 |
663,911 |
16.6% |
|
Operating income |
397,052 |
789,615 |
(49.7%) |
|
Interest expense |
(27,503) |
(9,426) |
191.8% |
|
Interest income |
9,230 |
1,344 |
586.8% |
|
Unrealized loss in valuation of financial derivative instruments |
(29,808) |
(318,362) |
(90.6%) |
|
Changes in fair value of warrants |
- |
(266,148) |
(100.0%) |
|
Foreign exchange gain (loss), net |
(8,236) |
5,811 |
(241.7%) |
|
Financing cost, net |
(56,317) |
(586,781) |
(90.4%) |
|
Income before income taxes |
340,735 |
202,834 |
68.0% |
|
Income taxes |
130,426 |
152,164 |
(14.3%) |
|
Net income including minority interest |
210,309 |
50,670 |
315.1% |
|
Non-controlling interest loss |
3,706 |
- |
(100.0%) |
|
Net income |
214,015 |
50,670 |
322.4% |
|
EBITDA breakdown (Ps. 420.1 million) | |||
|
Concept |
Q4 2021 |
Q4 2020 |
∆% |
|
Net income including minority interest |
210,309 |
50,670 |
315.1% |
|
(+) Income taxes |
130,426 |
152,164 |
(14.3%) |
|
(+) Financing cost, net |
56,317 |
586,781 |
(90.4%) |
|
(+) Depreciation and amortization |
23,717 |
17,132 |
38.4% |
|
EBITDA |
420,769 |
806,747 |
(47.8%) |
|
EBITDA margin |
19.3% |
31.0% |
(11.7%) |
|
Betterware de México, S.A.P.I. de C.V. | |||
|
Dec 2021 |
Dec 2020 |
∆% |
|
|
Net revenue |
10,039,668 |
7,260,408 |
38.3% |
|
Cost of sales |
4,399,164 |
3,290,994 |
33.7% |
|
Gross profit |
5,640,504 |
3,969,414 |
42.1% |
|
Administrative expenses |
1,195,509 |
664,677 |
79.9% |
|
Selling expenses |
1,264,581 |
853,355 |
48.2% |
|
Distribution expenses |
463,779 |
331,023 |
40.1% |
|
Total expenses |
2,923,869 |
1,849,055 |
58.1% |
|
Operating income |
2,716,635 |
2,120,359 |
28.1% |
|
Interest expense |
(74,626) |
(80,253) |
(7.0%) |
|
Interest income |
25,872 |
10,930 |
136.7% |
|
Unrealized gain (loss) in valuation of financial derivative instruments |
330,315 |
(287,985) |
(214.7%) |
|
Changes in fair value of warrants |
- |
(851,520) |
(100.0%) |
|
Foreign exchange gain (loss), net |
(319,739) |
(30,402) |
951.7% |
|
Financing cost, net |
(38,178) |
(1,239,230) |
(96.9%) |
|
Income before income taxes |
2,678,457 |
881,129 |
204.0% |
|
Income taxes |
855,377 |
542,768 |
57.6% |
|
Net income including minority interest |
1,823,080 |
338,361 |
438.8% |
|
Non-controlling interest loss |
3,706 |
- |
(100.0%) |
|
Net income |
1,826,786 |
338,361 |
439.9% |
|
EBITDA breakdown (Ps. $2,798.5 million) | |||
|
Concept |
Dec 2021 |
Dec 2020 |
∆% |
|
Net income including minority interest |
1,823,080 |
338,361 |
438.8% |
|
(+) Income taxes |
855,377 |
542,768 |
57.6% |
|
(+) Financing cost, net |
38,178 |
1,239,230 |
(96.9%) |
|
(+) Depreciation and amortization |
81,905 |
43,688 |
87.5% |
|
EBITDA |
2,798,540 |
2,164,047 |
29.3% |
|
EBITDA margin |
27.9% |
29.8% |
(1.9%) |
|
Betterware de México, S.A.P.I. de C.V. | ||
|
Dec 2021 |
Dec 2020 |
|
|
Cash flows from operating activities: |
||
|
Profit for the period |
1,823,080 |
338,361 |
|
Adjustments for: |
||
|
Income tax expense recognized in profit of the year |
855,377 |
542,768 |
|
Depreciation and amortization of non-current assets |
81,905 |
43,688 |
|
Accounting effects for changing reporting period |
(22,466) |
- |
|
Investment in subsidiaries |
10,356 |
- |
|
Interest income recognized in profit or loss |
(25,872) |
(10,930) |
|
Interest expense recognized in profit or loss |
74,626 |
80,253 |
|
Gain of property, plant, equipment sale |
- |
9,216 |
|
Unrealized (gain)/ loss in valuation of financial derivative instruments |
(330,315) |
287,985 |
|
Share premium account |
(18,304) |
32,910 |
|
Changes in fair value of warrants |
- |
851,520 |
|
Movements in working capital: |
||
|
Trade accounts receivable |
(70,612) |
(510,719) |
|
Trade accounts receivable from related parties |
(16,203) |
610 |
|
Inventory, net |
(63,114) |
(928,472) |
|
Prepaid expenses and other assets |
68,913 |
(95,532) |
|
Accounts payable to suppliers, accrued expenses and provisions |
(46,064) |
1,604,591 |
|
Provisions |
(35,843) |
104,319 |
|
Value added tax payable |
(32,573) |
(3,596) |
|
Statutory employee profit sharing |
47,951 |
2,348 |
|
Income taxes paid |
(779,444) |
(526,321) |
|
Employee benefits |
411 |
(743) |
|
Net cash generated by operating activities |
1,521,809 |
1,822,256 |
|
Cash flows from investing activities: |
||
|
Investment in associates |
(8,811) |
- |
|
Payments for property, plant and equipment, net |
(421,482) |
(617,686) |
|
Proceeds from disposal of property, plant and equipment, net |
24,409 |
18,270 |
|
Restricted cash |
- |
(42,915) |
|
Interest received |
29,853 |
10,930 |
|
Net cash used in investing activities |
(376,031) |
(631,401) |
|
Cash flows from financing activities: |
||
|
Repayment of financial derivative instruments |
(18,172) |
- |
|
Repayment of borrowings |
(646,554) |
(1,757,112) |
|
Proceeds from borrowings |
20,000 |
1,712,207 |
|
Long term debt |
1,480,664 |
- |
|
Interest paid |
(49,840) |
(121,297) |
|
Lease payment |
(6,498) |
(8,825) |
|
Cash received for issuance of shares |
- |
250,295 |
|
Dividends paid |
(1,400,000) |
(830,000) |
|
Net cash used in financing activities |
(620,400) |
(754,732) |
|
Net increase in cash and cash equivalents |
525,378 |
436,123 |
|
Cash and cash equivalents at the beginning of the period |
649,820 |
213,697 |
|
Cash and cash equivalents at the end of the period |
1,175,198 |
649,820 |
Use of Non-IFRS Financial Measures
This announcement includes certain references to EBITDA, EBITDA Margin, Net Debt:
EBITDA: defined as profit for the year adding back the depreciation of property, plant and equipment and right of use assets, amortization of intangible assets, financing cost, net and total income taxes
EBITDA Margin: is calculated by dividing EBITDA by net revenues
EBITDA and EBITDA Margin are not measures recognized under IFRS and should not be considered as an alternative to, or more meaningful than, consolidated net income for the year as determined in accordance with IFRS or as indicators of our operating performance from continuing operations. Accordingly, readers are cautioned not to place undue reliance on this information and should note that these measures as calculated by the Company, may differ materially from similarly titled measures reported by other companies.
Betterware believes that these non-IFRS financial measures are useful to investors because (i) Betterware uses these measures to analyze its financial results internally and believes they represent a measure of operating profitability and (ii) these measures will serve investors to understand and evaluate Betterware's EBITDA and provide more tools for their analysis as it makes Betterware's results comparable to industry peers that also prepare these measures.
About Betterware de México, S.A.P.I. de C.V.
Founded in 1995, Betterware de Mexico is the leading direct-to-consumer company in Mexico focused on creating innovative products that solve specific needs regarding organization, practicality, space saving and hygiene within the household. Betterware's wide product portfolio includes home organization, kitchen, commuting, laundry and cleaning, as well as other categories that include products and solutions for every corner of the household.
The Company has a differentiated two-tier network of distributors and associates that sell their products through twelve catalogues per year. All products are designed by the Company and under the Betterware brand name through its different sources of product innovation. The Company's state-of-the-art infrastructure allows it to safely and timely deliver its products to every part of the country, backed by the strategic location of its national distribution center. Today, the Company distributes its products in Mexico and Guatemala, and has plans of additional international expansion.
Supported by its asset light business model and its three strategic pillars of Product Innovation, Business Intelligence and Technology, Betterware has been able to achieve sustainable double-digit growth rates by successfully expanding its household penetration and share of wallet.
Forward-Looking Statements
This press release includes certain statements that are not historical facts but are forward-looking statements for purposes of the safe harbor provisions under the United States Private Securities Litigation Reform Act of 1995. Forward-looking statements generally are accompanied by words such as "believe," "may," "will", "estimate", "continue", "anticipate", "intend", "expect", "should", "would", "plan", "predict", "potential", "seem", "seek," "future," "outlook", and similar expressions that predict or indicate future events or trends or that are not statements of historical matters. The reader should understand that the results obtained may differ from the projections contained in this document and that many factors could cause our actual activities or results to differ materially from the activities and results anticipated in forward looking statements. For this reason, the Company assumes no responsibility for any indirect factors or elements beyond its control that might occur inside Mexico or abroad and which might affect the outcome of these projections and encourages you to review the 'Cautionary Statement' and the 'Risk Factor' sections of our annual report on Form 20-F for the year ended December 31, 2020 and any of the Company's other applicable filings with the Securities and Exchange Commission for additional information concerning factors that could cause those differences.
The Company undertakes no obligation and does not intend to update these forward-looking statements to reflect events or circumstances occurring after the date hereof. You are cautioned not to place undue reliance on these forward-looking statements, which speak only as of the date hereof. Further information on risks and uncertainties that may affect the Company's operations and financial performance, and the forward statements contained herein, is available in the Company's filings with the SEC. All forward-looking statements are qualified in their entirety by this cautionary statement.
Q4 2021 Conference Call
Management will hold a conference call with investors on February 10, 2022 at 8:00 am Central Standard Time (CST)/ 9:00am Eastern Time (EST). For anyone who wishes to join live, the dial-in information is:
Toll Free: 1-877-451-6152
Toll/International: 1-201-389-0879
Conference ID: 13726565
If you wish to listen to the replay of the conference call, please see instructions below:
Toll Free: 1-844-512-2921
Toll/International: 1-412-317-6671
Replay Pin Number: 13726565
We invite you to join our conference call, accompanied by our Earnings Call presentation that will be reviewed during the call. For full access to the presentation, please visit our investor relations website https://investors.betterware.com.mx/

![]()
![]() View original content to download multimedia:https://www.prnewswire.com/news-releases/betterware-reports-fourth-quarter-and-fiscal-year-2021-results-301480309.html
View original content to download multimedia:https://www.prnewswire.com/news-releases/betterware-reports-fourth-quarter-and-fiscal-year-2021-results-301480309.html
SOURCE Betterware de México, S.A.B. de C.V.
Released February 10, 2022